728x90
반응형
<template>
  <div id="map" class="map"></div>
  <div class="row">
    <div class="col-auto">
        <span class="input-group">
          <label class="input-group-text" for="type">Geometry type:</label>
            <select v-model="selectedType" @change="onTypeChange">
            <option value="Point">Point</option>
            <option value="LineString">LineString</option>
            <option value="Polygon">Polygon</option>
            <option value="Circle">Circle</option>
            <option value="None">None</option>
          </select>
          <button class="v-btn" id="undo" @click="undoLastPoint">Undo Last Point</button>
          <button id="???a" @click="geoJsonExport">정보 받기</button>
        </span>
    </div>
  </div>

</template>

<script setup>
import {onMounted, ref} from 'vue';
import Draw from 'ol/interaction/Draw.js';
import Map from 'ol/Map.js';
import View from 'ol/View.js';
import {Vector as VectorSource} from 'ol/source.js';
import {Tile as TileLayer} from 'ol/layer.js';
import {XYZ} from "ol/source";
import VectorLayer from "ol/layer/Vector";
import {ScaleLine} from "ol/control";
import {GeoJSON} from "ol/format";
import Select from "ol/interaction/Select";
import {defaults, DragBox, Translate} from "ol/interaction";
import {platformModifierKeyOnly} from "ol/events/condition";

// 필요한 데이터와 메소드를 Composition API로 정의
const selectedType = ref('None');
const draw = ref(null);
const map = ref(null);
const source = new VectorSource({ wrapX: false });

// 기본적인 openlayers OSM 타일레이어
/*const raster = new TileLayer({
  source: new OSM(),
});*/

// Draw 를 하기 위해 벡터레이어 깔기
const vector = new VectorLayer({
  source: source,
});

// 베이스로 쓸 타일 레이어 설정
const geobang = new TileLayer({
  source: new XYZ({
    url: 'http://www.khoa.go.kr/oceanmap/발급받은키/BASEMAP_3857/{z}/{y}/{x}/basemapWMTS.do'
  }),
})

const removeInteraction = () => {
  if (draw.value && map.value) {
    map.value.removeInteraction(draw.value);
  }
};

const addInteraction = () => {
  if (selectedType.value !== 'None') {
    draw.value = new Draw({
      source: source,
      type: selectedType.value,
    });
    map.value.addInteraction(draw.value);
  }
};

const onTypeChange = () => {
  removeInteraction();
  addInteraction();
};

// Remove the last point of a line or polygon
const undoLastPoint = () => {
  if (draw.value) {
    draw.value.removeLastPoint();
  }
};

// Export current feature information , excluding circles
const geoJsonExport = () => {
  const getGeo = new GeoJSON().writeFeatures(vector.getSource().getFeatures());
  console.log(getGeo);
}

// Ability to select and move features
const select = new Select();
const translate = new Translate({
  features: select.getFeatures(),
})

// box select (Multi-select) / Ctrl + drag for multi-selection
const dragBox = new DragBox({
  condition: platformModifierKeyOnly,
})
dragBox.on('boxend', () => {
  const extent = dragBox.getGeometry().getExtent();
  select.getFeatures().clear();
  source.forEachFeatureIntersectingExtent(extent, (feature) => {
    select.getFeatures().push(feature);
  })
})


onMounted(() => {
  // Map 객체 초기화
  map.value = new Map({
    interactions: defaults().extend([select, translate]),
    // layers: [raster, vector],
    layers: [
      geobang, vector,
    ],
    target: 'map',
    view: new View({
      // center: [-11000000, 4600000],
      center: [14126669.41589247, 4493404.190498611],
      zoom: 7,
    }),
  });


  // 스케일 바 생성
  map.value.addControl(new ScaleLine({ units : 'metric'}));
  map.value.addInteraction(dragBox);


  // 초기 인터랙션 추가
  addInteraction();
});
</script>

<style>
.map {
  width: 100%;
  /*height: 400px;*/
}

#map {
  height: 750%;
}

/*스케일바 css*/
.ol-scale-line {

}
</style>
생성된 피쳐를 누르면

조금 색이 진해지면서 선택이 되고

드래그 앤 드롭이 가능,
컨트롤 + 드래그를 하면
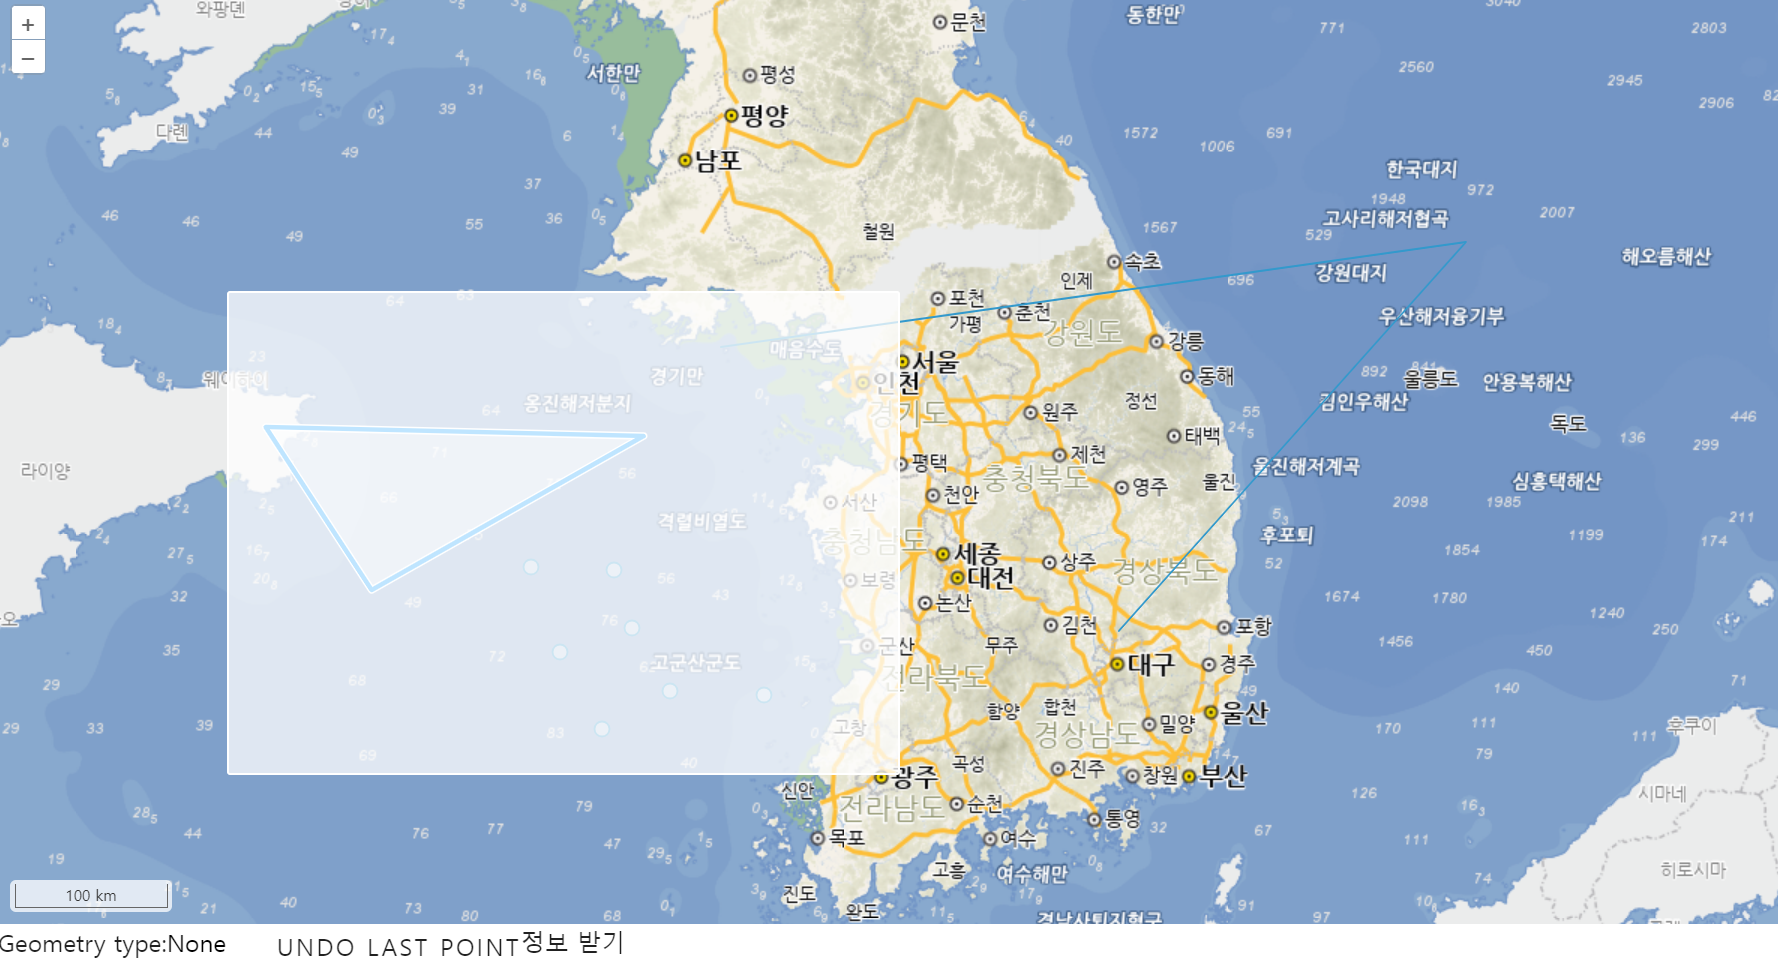
아래처럼 영역안에 피쳐가 선택된다ㅇㅇ

ㅇㅇ굿
728x90
반응형
'GIS > OpenLayers' 카테고리의 다른 글
| 스케일 / 피쳐정보 (1) | 2024.07.22 |
|---|---|
| openLayers 기본 지도 & Draw (0) | 2024.07.22 |